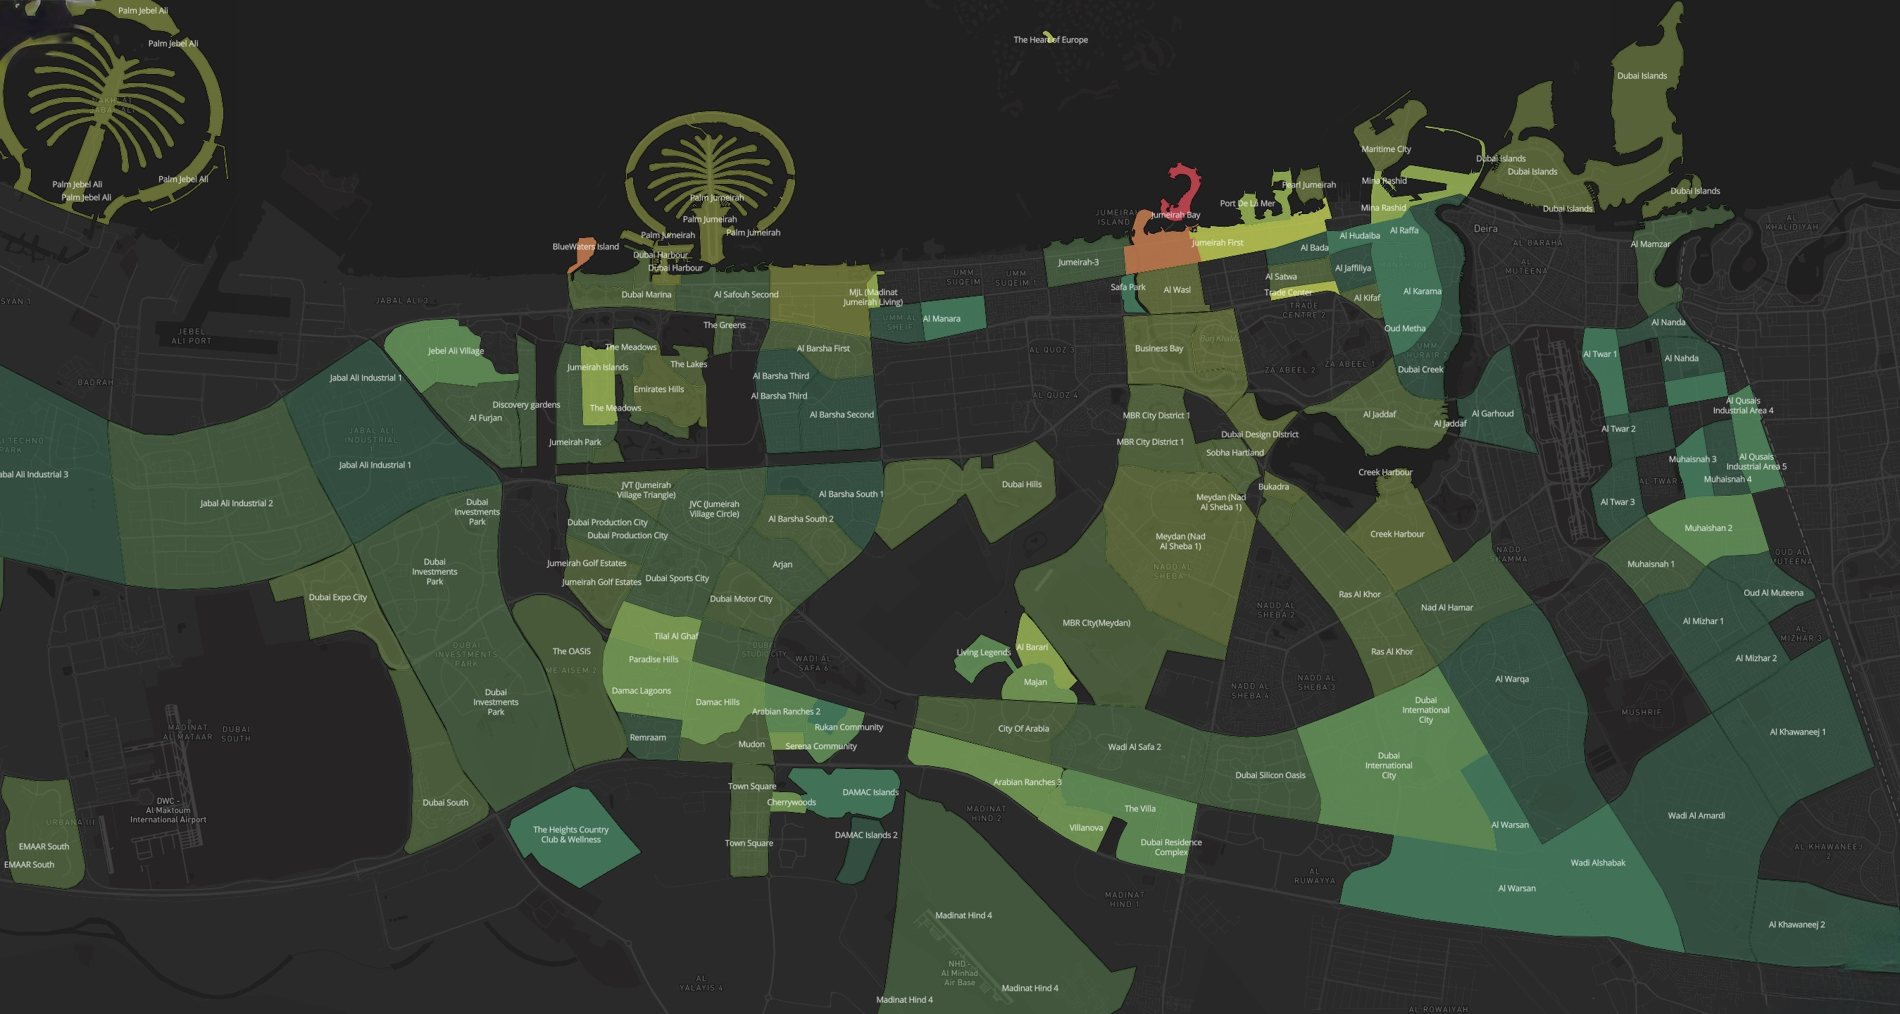
Every zone shaded by investment profile — from established prime on the coast to the frontier master plans inland.
Ranked on yield, capital growth, incoming supply risk and tenant demand — then placed on the map so the geography makes sense.
Every zone shaded by investment profile — from established prime on the coast to the frontier master plans inland.
The half-year that reset the floor: record volumes, record first-time buyers, and off-plan still doing the heavy lifting.
| 🏗️ Off-Plan vs 🏠 Ready | Share | Avg. Ticket |
|---|---|---|
| 🏗️ Off-plan transactions | 67% | AED 2.38M |
| 🏠 Ready / secondary | 33% | AED 5.39M |
| 💡 What it means | Off-plan drives volume; secondary buyers pay the premium — the construction-phase margin is real. | |
| 🌍 Who's Buying | Share of Foreign Demand |
|---|---|
| 🇮🇳 India | 20.6% |
| 🇬🇧 United Kingdom | 13.3% |
| 🇪🇬 Egypt | 12.6% |
| 🇺🇸 United States | 9.0% |
| 🇵🇰 Pakistan | 6.9% |
Averages hide alpha. Dubai isn't one market — it's a portfolio of zones, each with a distinct weapon.
| Community | AED / Sqft | Gross Yield | Profile |
|---|---|---|---|
| ◆ Palm Jumeirah | 3,750 | 4–5% | Ultra-luxury benchmark |
| Downtown Dubai | 3,011 | 5–6% | Premium liquidity king |
| Dubai Marina | 2,600 | 5.5–7% | Highest expat rental demand |
| Business Bay | 2,547 | 6.5–7.6% | Income + appreciation combo |
| Dubai Hills Estate | 2,350 | 5.4–6% | Premium golf-view play |
| Dubai Creek Harbour | 2,050 | 5–6.5% | Waterfront off-plan value |
| Dubai Islands | 2,000 | 5–7% | Explosive growth corridor |
| JVC | 1,460 | 7–9% | Highest deal volume in Dubai |
| International City | 775 | 9–10% | Highest gross yields, period |
You don't buy the Palm for yield. You buy it because they're not making more of it — finite land, global demand, zero substitutes.
The two most tradeable addresses in the emirate: deepest premium resale market, zero-vacancy rental demand. The core allocation.
AED 2,000/sqft frontier absorbing capital at a pace emerging zones aren't supposed to manage. Today's entry is tomorrow's case study.
The cash-flow weapons: 7–9% in JVC on the highest deal volume in Dubai; 9–10% gross in International City from AED 775/sqft.
★ Portfolio logic: preserve in Palm Jumeirah, trade in Downtown & Marina, grow in Dubai Islands, earn in JVC & International City. One city, four strategies — every risk profile armed.
June closed at AED 32.66B with volume up +31.3% over May — the supposed quiet season behaving like a launch window. Momentum is compounding into H2.