Free Ebook
Dubai vs. Abu Dhabi 2026
- Entry pricing, yields and liquidity — side by side
- The catalysts driving each capital through 2030
- The allocation framework: how to weight the two markets
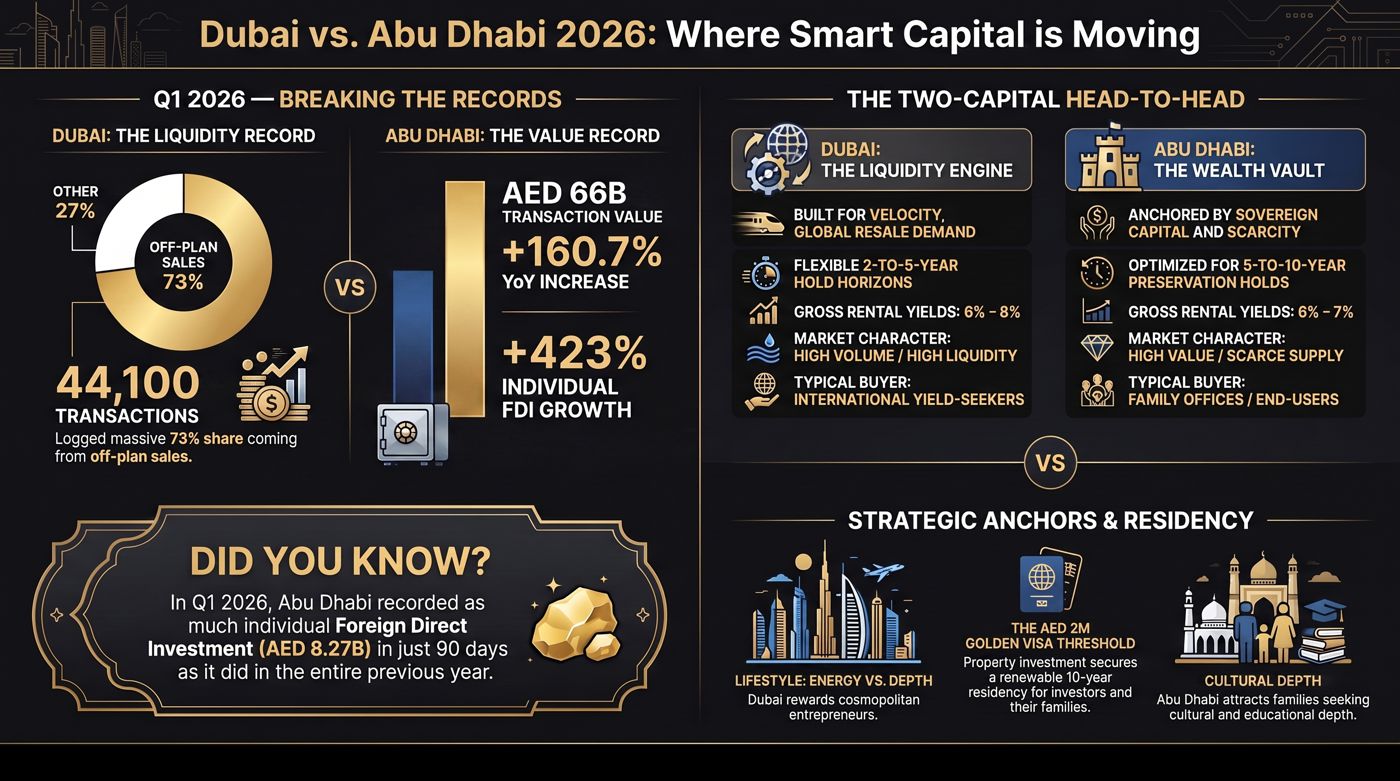
Two capitals, one framework. Dubai is the liquidity market; Abu Dhabi is the fundamentals market. The right answer is usually a weighting, not a choice.
↓ Download the E-Book — Dubai vs. Abu Dhabi 2026Dubai anchors the portfolio: deepest tenant pool, fastest exits, every strategy from short-let to trophy. Abu Dhabi is the compounder: lower entry, steadier tenancy, institutional landlords and the Hudayriyat/Saadiyat pipeline.
A common structure for global investors: 60–70% Dubai core, 20–30% Abu Dhabi fundamentals, 10–20% northern-emirates catalyst — then rebalance as the data moves. The e-book walks through the full framework.
| Factor | Dubai | Abu Dhabi |
|---|---|---|
| Market Depth | Deepest in region — global buyer pool | Growing — regional + institutional |
| Volatility | Higher — global flows | Lower — end-user & institutional base |
| Key Developers | Emaar, Sobha, Omniyat, Nakheel | Aldar, Modon, Bloom |
| Growth Catalysts | Palm Jebel Ali, Dubai Islands, D33 | Hudayriyat, Saadiyat museums, ADGM |
| Golden Visa | AED 2M+ · 10 years | AED 2M+ · 10 years |